One very interesting class I took this quarter was ECON45: Using Big Data to Solve Economic and Social Problems. In addition to learning about statistical techniques, quasi-experimental models, and real-world applications of “big data” (or “wide data” – tons of things are observed, leading to datasets with more variables than observations), the class gave some insights into how to solve machine learning problems. We didn’t go into a lot of technical detail, but thanks to some Stats classes I’ve taken, coupled with proficiency in R, I decided to take the lessons learned in this class and apply it to a real-world problem of my own.
As a Senior Associate of the Stanford Pre-Business Association this year, I got to work with a large company to help them determine important demographic insights when expanding their product into some new markets. One challenge for the team was figuring out how to digest the open-ended questions, given the amount of responses gleaned from our market research survey. I turned to one lecture on the idea of n-gram analysis to solve this problem.
N-gram analysis is an application of machine learning that allows you to find patterns in large quantities of text. After cleaning up the data a little bit, I wrote some code* in R that takes in a .txt file, makes the format more easily readable, and then displays the most frequent phrases of a length of your choosing. I decided to focus on bigrams and trigrams, or 2-word and 3-word phrases, respectively, since these phrases tend to be the most telling.
This process required a fairly steep learning curve, since I had never actually done this analysis before – we discussed its usefulness in class during a guest lecture by Matt Gentzkow, but never went into the nitty-gritty of actually creating the process beyond getting some off-the-shelf code. In the end, bigram and trigram analysis actually saved me a lot of time. Instead of digging for things I thought were super important, I could just let an algorithm tell me in a couple seconds, and then apply the same method by creating another .txt file.
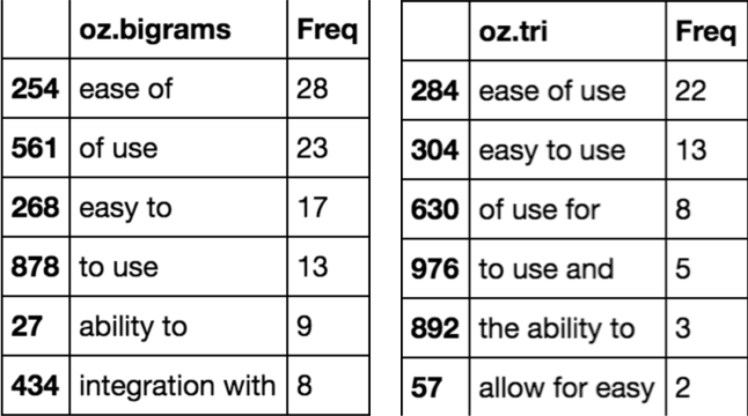
Of course, some human sleuthing helped improve the analysis as well. After determining “ease of use” and “easy to use” were very important to people we surveyed, I revisited the data and found that ease of use applied both to people using the product and for their consumers who would need to use the product as well – easy user experience for all involved was a crucial differentiating factor that people placed as their highest priority.
Overall, the process of human learning was just as fun as seeing the end results of my machine learning – it’s really exciting to see what avenues there are to explore by combining the art and science of Economics, or the needs of the business realm, with tools from computer science!
*If you’re interested in the code I used, check out my Github: https://github.com/andrewjabara/bigrams/blob/master/mlcode.r
