Have you checked the price of a Big Mac recently? It’s a fascinating indicator for our purchasing power in the United States.
I use data from the US Department of Labor and The Economist’s Big Mac Index to calculate how many Big Macs the average minimum-wage US worker could afford from 1 hour of gross wages: the “Big Mac Purchasing Power”. It’s imperfect, but it’s a great way to visualize and compare how affordability changes across the decades.
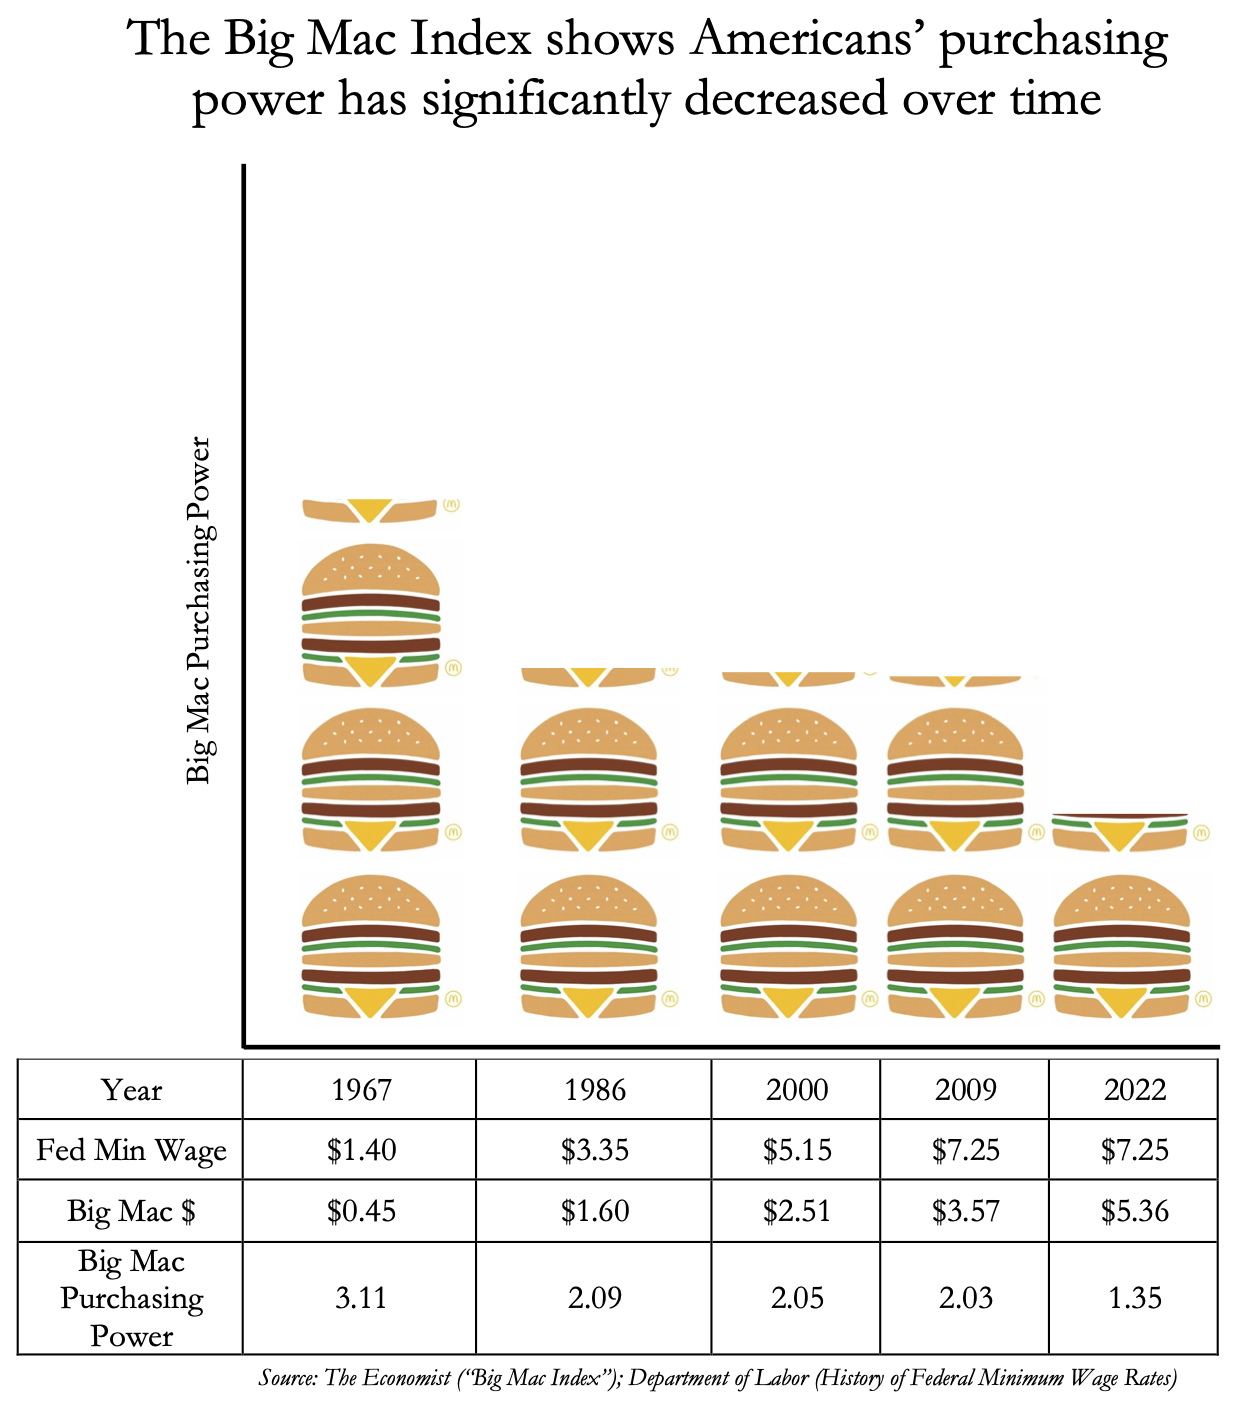
In 1967, the Big Mac debuted on the McDonald’s menu for 45 cents, while the USA federal minimum wage in 1967 was $1.40/hour. That’s 3.1 Big Macs for 1 hour of gross wages.
In 1986, at the start of The Economist’s “Big Mac Index”, a Big Mac cost an average of $1.60 in the US and the minimum wage rose to $3.35/hour, for a total of 2.09 Big Macs/hour.
In 2000, a Big Mac cost an average of $2.51 while the minimum wage rose to $5.15, for a total of 2.05 Big Mac/hour.
The last time the minimum wage was raised was in 2009, up to $7.25/hour, a Big Mac cost $3.57. Purchasing power decreased slightly to 2.03 Big Macs/hour, but still comparable to 1986 levels.
Almost 15 years later, the minimum wage remains at $7.25/hour, and a Big Mac costs $5.36, for 1.35 Big Macs/hour. McDonald’s isn’t hurting, either – it’s delivered blowout earnings the past few quarters.
Here’s another way to think about this: to achieve the same purchasing power of the last 40 years, the minimum wage would need to be around $11/hour. To match the purchasing power of 1967, when the first wave of Baby Boomers entered the workforce, the minimum wage would need to be $16.61/hour.
One big caveat here is the use of averages, which can hide interesting insights on either end of the distribution. As it turns out, cities with higher Big Mac prices are actually doing a lot better for relative purchasing power because of relatively higher minimum wages, even if purchasing power has still fallen overall. According to McCheapest, the cheapest Big Mac available as of June 2023 is $3.49 in Stigler, OK, for a relative purchasing power of 2.08 (Oklahoma’s minimum wage is $7.25/hour). Compare that to a Big Mac in San Francisco, CA that costs $5.99, but where the minimum wage is $17/hour – the Big Mac Purchasing Power in SF is 2.83! On the flipside, there are a lot of examples of even lower purchasing power: the McDonald’s in Shelby, IA has Big Mac listed for $6.59, for 1.1 Big Macs/hour (Iowa’s minimum wage is $7.25/hour).
